Follow Us x
Dissecting 2020 FCC Communications Market Place Report
By Sergey Dluzhevskiy, CFA, CPA, Paul Fanelli, and Hanna Howard
January 25, 2021
In this white paper, we “dissect” the FCC Communications Marketplace Report, highlighting some of the data presented and sharing our takes on that information as well as views on competitive environment and various sector-specific topics.
Dissecting 2020 FCC Communications Marketplace Report
On December 31, 2020, the Federal Communications Commission (FCC) published its bi-annual Communications Marketplace Report that provides an overview of the state of communications marketplace, competition in various segments of the market, actions that the FCC has taken over the past two years to address challenges and opportunities in the marketplace, as well as some of the items on the agency’s agenda over the next two years. While the report largely presents December 2019 data (with some updates for 2020), it represents one of the most comprehensive publicly available sources of information on various segments of the US communications services industry. In our white paper, we “dissect” the FCC Communications Marketplace Report, highlighting some of the data presented and sharing our takes on that information as well as views on competitive environment and various sector-specific topics.
WIRELESS
The Mobile Wireless Marketplace
The mobile wireless marketplace primarily consists of the three facilities-based nationwide mobile operators (Verizon Wireless, T-Mobile, AT&T), numerous regional and local facilities-based providers (US Cellular is the largest regional operator), mobile virtual network operators (MVNOs) who purchase mobile wireless services on a wholesale basis, cable providers that rely on hybrid wholesale/hotspot arrangement to offer service, as well as mobile satellite providers who currently primarily focus on niche services.
Exhibit 1 Total Mobile Wireless Connections (2016 - 2019)
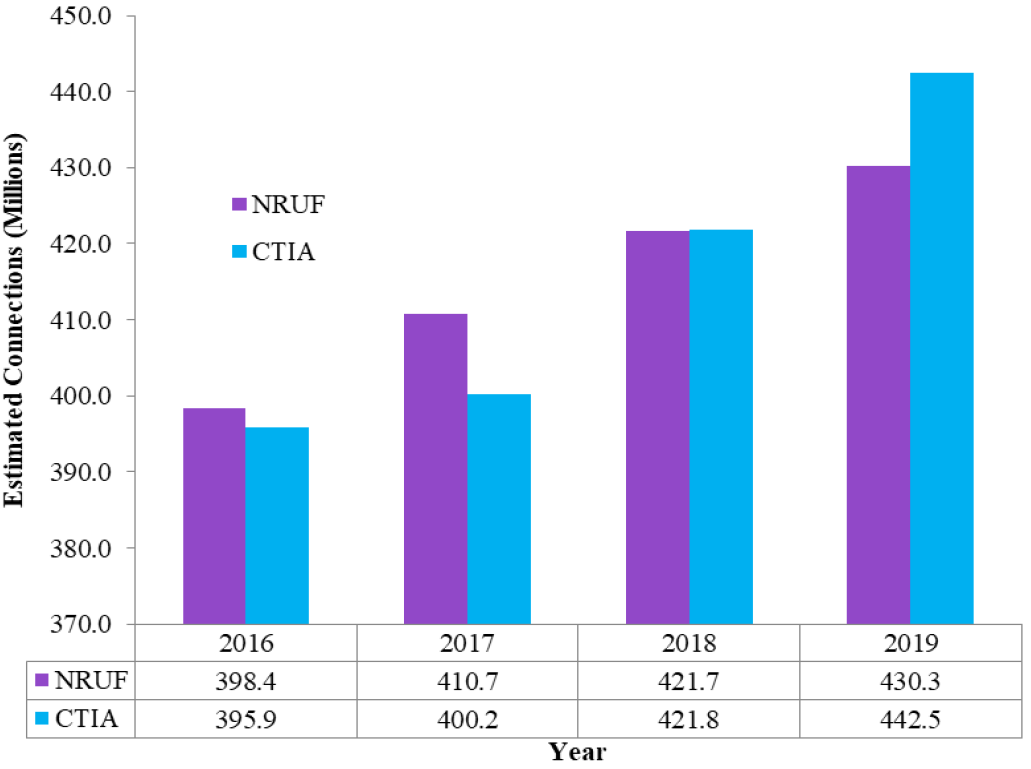
Source: FCC 2020 Communications Marketplace Report
The FCC provided several estimates for the number of wireless connections (See Exhibit 1), using data from CTIA (trade association for the wireless industry) and NRUF (Numbering Resource Utilization / Forecast; tracking how many phone numbers have been assigned to mobile wireless devices). According to CTIA data, total mobile wireless connections reached over 440 million at the end of 2019 (while NRUF data puts that number at 430 million). The growth in mobile connections (2-5% CAGR over the past 2 years, depending on data source) also came with increased growth in data usage (9.2 GB per smartphone in 2019 vs. 5.1 GB in 2017). Rising data consumption was facilitated by increasing availability of unlimited data plans as well as increased speeds offered by service providers (e.g. 4G LTE download speeds increased from 16 Mbps in 2H’17 to 26.2 Mbps in 2H’2019).
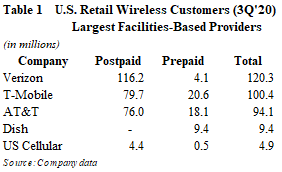
Following completion of its acquisition of Sprint in April 2020, T-Mobile US has moved into the #2 market share position (ahead of AT&T) in terms of total retail and postpaid customers (see Table 1). The company has been taking share and, as of 3Q’20, has led the industry in total branded net customer additions for the 23rdconsecutive quarter. We expect the firm’s robust operating momentum to continue in 2021, supported by its strong spectrum position (including the largest mid-band position in the US) and opportunities to increase penetration in some of the customer segments where T-Mobile is under-indexed (e.g. small rural towns, prime suburban families, enterprise, military personnel, age over 55, etc.).
While T-Mobile/Sprint merger reduced the number of national wireless operators from 4 to 3 (at least in the near- to medium-term), which should lead to more rational pricing and competitive environment over time, it has also enabled Dish Network’s entry into the wireless industry due to regulatory concessions (including 7-year MVNO with T-Mobile, sale of Boost Mobile (prepaid) to Dish, eventual sale of iDEN spectrum, etc.). Time will tell whether Dish will get more aggressive on the retail side (including entering postpaid segment), or it will largely focus on building a 5G wholesale network and leasing it to major wireless providers and/or other customers (including technology companies). We believe that Dish will likely be more focused on the latter. The long-term MVNO agreement with T-Mobile as well as an option for Dish to take over decommissioned Sprint cell sites (minimum of 20K) and retail stores (minimum of 400) certainly provide the company with meaningful flexibility how to pursue its network build and/or retail/wholesale strategy.
Cable providers have started entering the wireless market through MVNO arrangements. They largely rely on wholesale access to facilities-based partners’ networks, supplemented by hotspot or small-cell networks that send a portion of the traffic through the cable provider’s infrastructure. Comcast and Charter have MVNO agreements with Verizon Wireless. Comcast launched Xfinity Mobile in the spring of 2017 and has reached nearly 2.6 million wireless lines as of 3Q’20, while Charter began offering its service in the summer of 2018 and has grown to more than 2 million mobile lines by September 30, 2020. The companies have recently acquired CBRS spectrum and are among qualified applicants for the ongoing C-band auction (see Spectrum section for further details). As cable operators scale their wireless businesses, we expect them to look for opportunities to offload a greater share of traffic to own facilities (including acquiring more spectrum). In addition, to the extent wireless operators are successful with 5G fixed wireless offerings, cable companies may look to become more of facilities-based mobile operators for both offensive and defensive purposes over time, looking for ownership economics and improved competitive position.
Market Concentration
Over the past three decades, the wireless industry has consolidated significantly, as companies looked to increase scale, improving network coverage and profitability along the way. T-Mobile / Sprint was the last landmark deal in the sector (closed 4/1/20). This transaction has amplified shareholder value creating opportunity for TMUS, with improved competitive position, strong spectrum portfolio, meaningful synergy potential (NPV of $43 billion), and ability to build a high-capacity differentiated 5G network. With over 100 million branded customers, the combined company now has the scale and resources to supercharge T-Mobile’s Un-carrier strategy to better compete with AT&T, Verizon, and cable companies entering the wireless sector. Other recent transactions included sale of Boost Mobile (prepaid business of Sprint) to DISH Network (addressing a requirement under the DOJ consent decree), and pending acquisition of Tracfone by Verizon (Tracfone, owned by America Movil, is the largest prepaid operator in the US, operating as an MVNO).
A combination of #3 and #4 operators (in T-Mobile/Sprint deal) increased concentration in the market which had already been viewed as highly-concentrated. To measure mobile wireless market concentration, the FCC and the Department of Justice employ Herfindahl-Hirschman Index (HHI), widely used in competition analysis (the HHI is calculated by summing the squared market shares of all firms in the given market). In the 2020 FCC Communications Marketplace Report, the Commission noted that, as of year-end 2017, the weighted average HHI (weighed by population across the 172 Economic Areas (EAs) in the United States) for mobile wireless services was 3,106. As of year-end 2019, pro forma for T-Mobile / Sprint transaction, the weighted average HHI for mobile wireless services by EA was 3,622. To put this figure in perspective, the DOJ typically classifies markets into three types: unconcentrated (with HHI below 1,500), moderately concentrated (between 1,500 and 2,500) and highly concentrated (above 2,500). Mergers resulting in highly concentrated markets that involve an increase in HHI of more than 200 points typically are presumed to be likely to enhance market power.
Given high level of market concentration, it appears unlikely we will see any more mergers between Top 3 national wireless carriers. With that said, potential acquisitions of regional wireless operators (like US Cellular (~5 million customers) or privately-held C Spire (with nearly 1 million customers) would likely not trigger significant regulatory challenges and could be easily absorbed by any of the national carriers.
Moreover, we expect that with fixed wireless solutions (via 5G) becoming more viable competitors to fixed broadband services over time, regulators will likely be more open to broadening definition of the market from mobile services to all types of broadband. T-Mobile, which has no fixed-broadband presence currently, but plans to roll out fixed-wireless broadband services via 5G, may eventually become an acquisition target for Comcast or a JV of Comcast and Charter (with or without participation from Liberty).
Spectrum
Spectrum refers to the invisible radio frequencies that wireless signals travel over, enabling voice and data services. It is the lifeblood of wireless. It can affect whether, when, and where existing service providers and potential new entrants will be able to expand capacity and deploy networks. In its Communications Marketplace Report, the FCC provided updated information about major carrier spectrum holdings (i.e. spectrum depth - national population-weighted average MHz holdings by licensee), which we summarized in Tables 2 and 3 below.
We classify sub-1 GHz spectrum as low-band (includes 600 MHz, 700 MHz, cellular, and SMR spectrum) and 1-3 GHz spectrum as mid-band (including PCS, AWS, WCS, and BRS/EBS (2.5 GHz). Millimeter-wave (mm-wave) classification includes 24, 28, upper 37, 39, and 47 GHz bands.
Table 2 Low- and Mid-Band Spectrum Depth
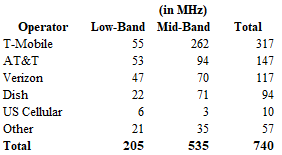
Table 3 MM-Wave Spectrum Depth
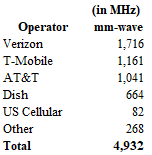
Note: excludes CBRS auction results (September 2020).
Source: 2020 FCC Communications Marketplace Report, Gabelli Funds estimates.
Lower frequency bands provide wider coverage (as waves can travel longer distances with minimal signal interruption). Today’s wireless networks are built primarily on low-band and lower mid-band spectrum (sub-3 GHz). However, lower bands tend to have relatively poor capacity, as this spectrum is in limited supply and only narrow bands are available. In contrast, higher bands tend to provide greater capacity, making it easier to create broad channels, allowing more information to be carried at ultra-fast speeds. However, they travel much shorter distances (compared to lower-bands). Mid-band spectrum provides a good balance on propagation and capacity.
Following T-Mobile / Sprint merger (and prior to the ongoing C-band auction), TMUS has the strongest low- and mid-band position in the US, with ~317 MHz weighted average spectrum depth nationwide (about 2x AT&T’s comparable spectrum holdings and ~2.7x Verizon’s). On the other hand, Verizon is the leader in mm-wave spectrum (with 1,716 MHz nationwide).
Exhibit 2 5G Characteristics
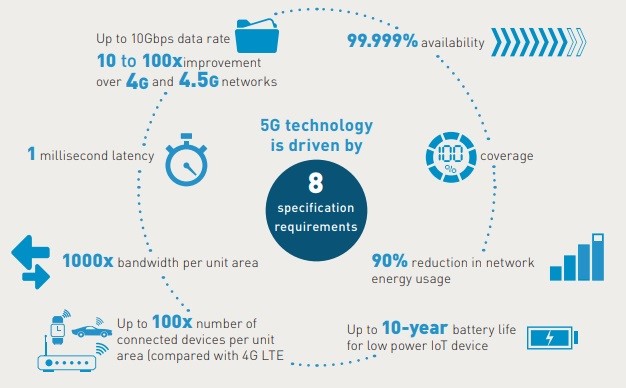
5G: One of the key trends in wireless is migration to 5G, the next generation of wireless network technology, that is expected to enable massive digital transformation of our society. 5G is expected to provide super-fast data speeds in excess of 1 gigabit per second, ultra-low sub-1 millisecond latency, and ability to connect up to 100 times more devices than today’s 4G networks in order to support rapidly growing Internet of Things. 5G will provide not only higher speeds and low latency, but also a foundation for completely new use cases, including autonomous vehicles, immersive gaming with virtual reality elements, remote surgery, and unprecedented factory automation. 5G will be critical to the proliferation of the Internet of Things (IoT). Telecom operators are uniquely positioned to provide the connectivity that forms the basis of IoT ecosystems and layer security and quality of service on top of that connectivity base, becoming true enablers of the IoT era.
To fully realize the 5G future, operators will need timely release of spectrum. They will need more spectrum and wider channels than in the past. It is fair to say that the industry will be utilizing all spectrum bands for 5G, with most carriers likely pursuing a “layer cake” approach for network builds (foundation of low-band (for coverage), significant layer of mid-band, and a layer of mm-wave (high-band; for capacity)). With that said, mid-band, due to a good combination and balance of propagation and capacity, would likely become the primary building block (at least over the next 5-7 years).
FCC Auction 107: Given the importance of mid-band spectrum and T-Mobile’s significant lead in that category, FCC Auction 107 (currently ongoing) has been viewed as particularly important for wireless carriers, as it (a) offered a wide chunk of mid-band spectrum (280 MHz of C-band spectrum in 3.70-3.98 GHz band), conducive to aggregating sizeable blocks of spectrum per market; (b) was not constrained by presence of governmental entities which get priority; (c) provided an opportunity for Verizon and AT&T to get closer or catch-up to T-Mobile’s position in low- and mid-band spectrum. In addition, it is an international band, which presents roaming opportunities. While we expected VZ and T to get aggressive, the auction has already significantly exceeded our and consensus estimates in terms of total bids.
As of January 15, 2020, after 97 rounds of bidding in FCC Auction 107, gross proceeds stood at $80.9 billion (with the clock phase of the auction completed). However, to estimate total spectrum purchase costs for auction participants, one needs to factor in additional bids during the assignment phase as well as accelerated relocation payments ($9.7 billion) and reasonable relocation (clearing) costs (we estimate at $4.25 billion at mid-point), as they will be paid by the winning bidders in addition to their net auction bids. We estimate final all-in spectrum purchase costs at ~$95.5 billion (implying total valuation of ~$1.11/MHz*POP).
In Tables 4 and 5 below, we are presenting our expectation for breakdown of total spectrum purchase cost by component and by major wireless carrier. We expect Verizon to end up as the largest winning bidder, accounting for ~45% of total spectrum purchase costs. We expect VZ to be particularly aggressive as it has the smallest low- and mid-band spectrum portfolio among the Big 3 and will need to enhance it to get closer to T-Mobile in terms of mid-band spectrum depth, in order to improve its competitive position in 5G. We expect AT&T to be the second-largest bidder (~23% of total spectrum purchase costs), looking to improve its competitive position in 5G, although it would be somewhat limited due to its elevated leverage. T-Mobile has the largest low- and mid-band spectrum position, going into the auction. Thus, we expect TMUS to be opportunistic, possibly trying to add spectrum in certain markets and/or block competitors in others.
Table 4 Estimated Spectrum Purchase Costs (Auction 107) Table 5 Estimated Spectrum Cost Distribution
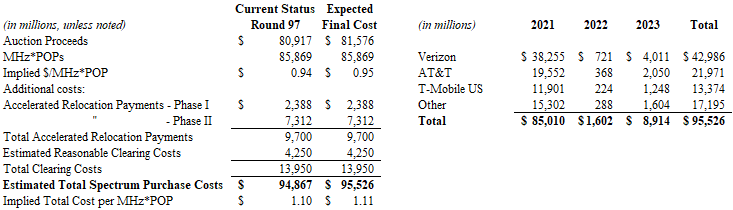
Source: FCC data and Gabelli Funds estimates.
The FCC is targeting to auction another 100 MHz of mid-band spectrum in late 2021. However, that 3.45-3.55 GHz band is likely going to be viewed as less valuable by operators (compared to C-band), as, similarly to CBRS (auction completed in September 2020), it will be shared by federal incumbents and commercial operators (with federal incumbents getting the priority). The band is currently being used by the Department of Defense to operate high-powered defense radar systems on fixed, mobile, shipborne, and airborne platforms.
FIXED BROADBAND
Overview of Fixed Broadband Marketplace
The US fixed broadband marketplace consists primarily of traditional cable and telecom service providers, but also includes companies providing broadband via fixed wireless and fixed satellite technologies. As of December 2019, there were 2,052 entities of various sizes and deployment footprints that reported providing fixed broadband services to residential consumers (that figure has grown by ~26% since June 2014). In terms of population coverage, AT&T had the largest fixed broadband footprint, covering ~41% of the US population, followed closely by cable operators Comcast and Charter, covering approximately 36% and 33% of the country’s population, respectively (See Exhibit 2 for additional information; based on FCC Form 477 deployment data (note: all facilities-based broadband providers are required to file data with the FCC twice a year (Form 477) on where they offer Internet access service at speeds exceeding 200 kbps in at least one direction)).
Exhibit 3 US Providers of Residential Fixed Broadband Services by Population Coverage (12/31/19)
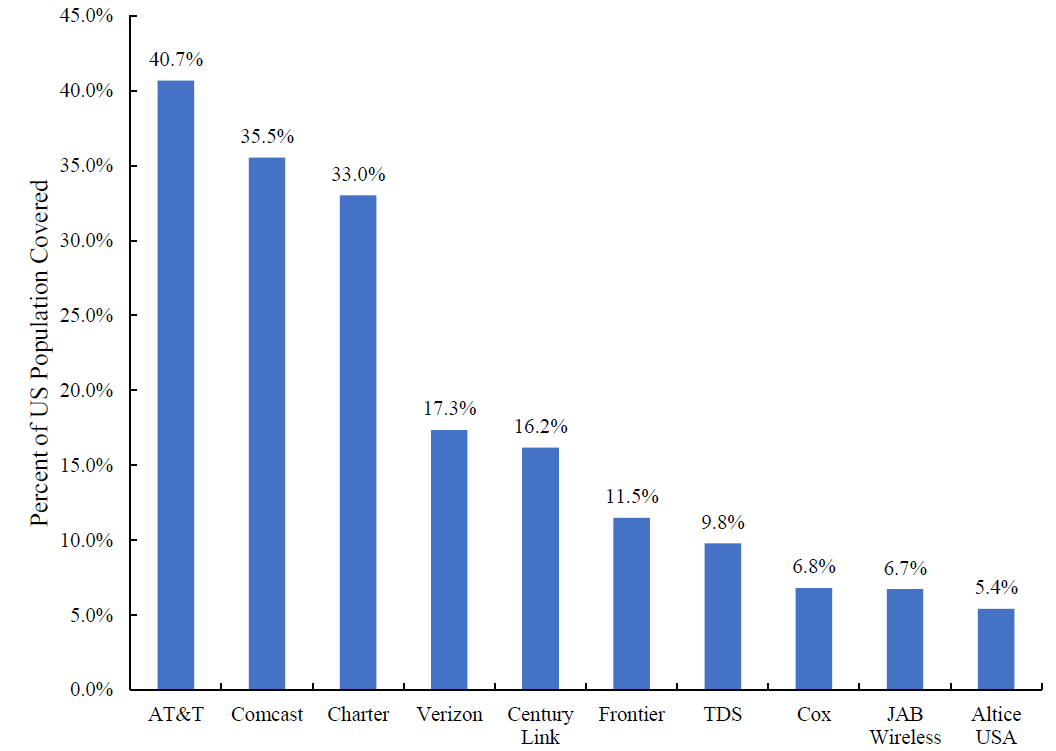
Source: 2020 FCC Communications Marketplace Report; FCC Form 477 deployment data for residential consumers; 2010 Census data.
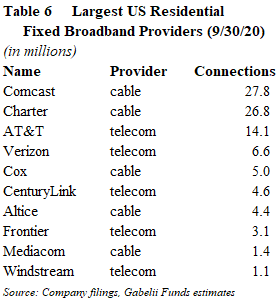
While AT&T has the largest population coverage, cable companies, Comcast and Charter, were meaningfully ahead of it in terms of total residential fixed broadband connections, both as of 2019 and as of September 30, 2020 (see Exhibit 3). This is not surprising as cable broadband remains the most dominant broadband technology in the US. As of December 31, 2019, cable technology represented ~64% of residential broadband connections (up from ~60% in December 2015), while DSL and fiber-to-the premise (FTTP) accounted for 17% and 16%, respectively (see Exhibits 4 and 5). Currently, most providers of cable broadband service have deployed a hybrid fiber-coaxial (HFC) technology that transmits signals over a fiber from the provider’s facility to an optical node near the consumer. These providers typically use coaxial cable to send the signal from the optical node to the customer’s end location. DOCSIS 3.1 (Data Over Cable Service Interface Specifications 3.1), the latest standard deployed to approximately 84% of US households (as of December 2019), is capable of achieving 10 Gbps download speed and 1 Gbps upload speed.
Exhibit 4 US Deployment & Residential Fixed Broadband Connections (millions) (December 31, 2019)
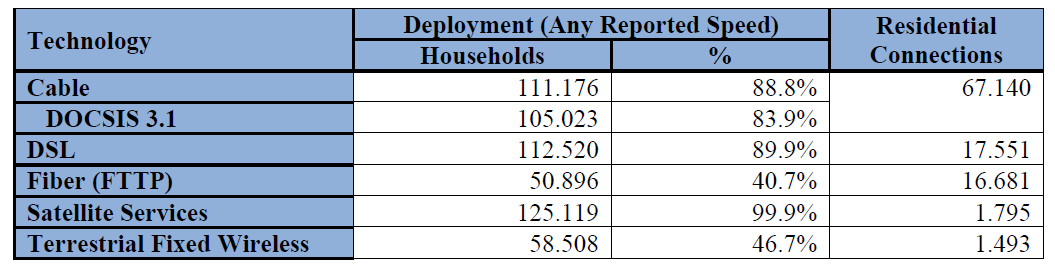
Source: 2020 FCC Communications Marketplace Report.
The majority of US population has access to at least two fixed broadband providers, although, in certain instances, one could be offering a more superior product (e.g. cable DOCSIS 3.1 competing with DSL or telco FTTP competing with legacy cable technology). Thus, the FCC, in its Communications Marketplace Report, presented data focused both on multiple broadband options’ availability and speeds associated with these options. The Commission noted that, as of December 2019, approximately 84% of Americans had at least two options for 10/1 Mbps fixed terrestrial service; approximately 74% had at least two options for 25/3 Mbps fixed broadband offering; ~55% had at least two options for 100/10 Mbps service; ~35% had at least two options for 250/25 Mbps.
Exhibit 5 US Residential Fixed Broadband Connections (in thousands) (2015 - 2019)
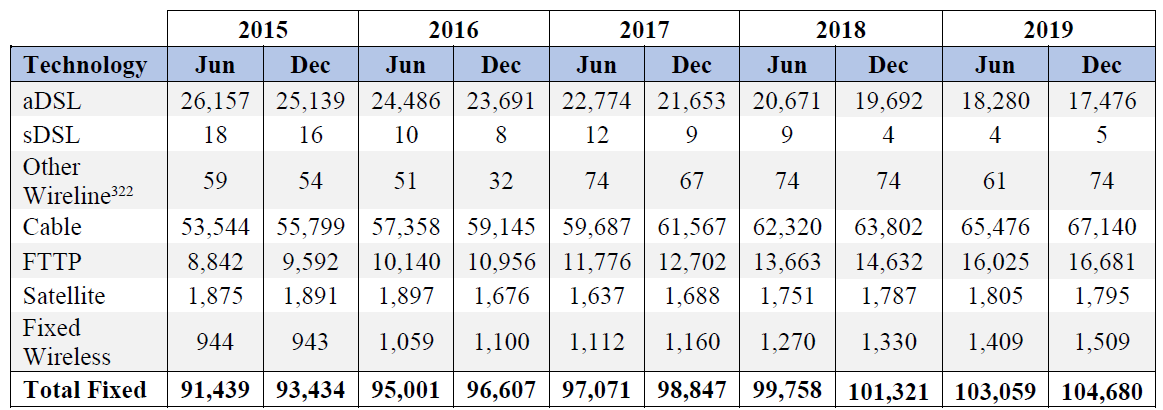
Source: 2020 FCC Communications Marketplace Report.
The COVID-19 pandemic has highlighted the essential nature of high-quality broadband networks (both fixed and mobile) and broad digital infrastructure, as well as the value of connectivity in today’s economy. By and large, US fixed and wireless broadband networks have handled initial spikes and ultimate redistribution of traffic caused by pandemic-driven global work-from-home, telemedicine, and online learning initiatives quite well. However, the coronavirus crisis has also highlighted digital divide between urban and rural areas. That divide can also be visible from the 2020 FCC Communications Marketplace Report data. For example, while ~55% of Americans had at least two provider options for 100/10 Mbps service, the difference in availability was significant between urban and rural areas. In urban areas, more than two options of 100/10 Mbps service were available to ~65% of population, while in rural areas the comparable figure was ~20%. In the 250/25 Mbps speed tier, two or more provider options were available to over 41% of population in urban areas, while the comparable statistic for rural areas was just over 10%.
The FCC and Congress will likely continue to focus on “bridging digital divide” between urban and rural areas and supporting increased availability of high-speed broadband services in unserved or underserved areas in the US. The funding to help increase broadband speeds in rural areas or bring high-quality broadband to certain markets for the first time will likely come from specific FCC programs (under the Universal Service Fund umbrella) and/or infrastructure-focused bills from Congress (with infrastructure likely being an area that should find bi-partisan support). President Biden, in his infrastructure plan communicated during his election campaign, noted that he will invest $20 billion in rural broadband infrastructure and triple funding to expand broadband access in rural areas.
Exhibit 6 US Residential Fixed Broadband Connections (in thousands) By Speed Tier (12/31/19)
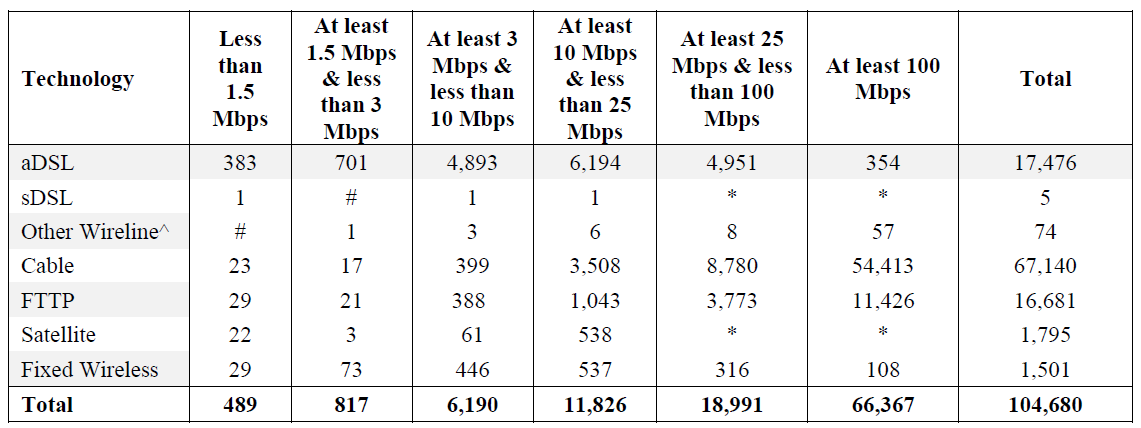
Source: 2020 FCC Communications Marketplace Report.
Telecom companies, from AT&T to small regional providers, continue to invest in upgrading their plant with fiber, increasing penetration of fiber-to-the-premise (FTTP) technology. FTTP uses optical fiber to deliver a signal from the operator’s equipment to the residential customer. Typically, in markets where telcos offer fiber (particularly, FTTP) they have a meaningful opportunity to take share (given symmetrical gigabit speeds and dedicated bandwidth). While we haven’t seen sizeable regional telecom combinations since CenturyLink/Qwest almost a decade ago, smaller fiber-rich wireline assets have started attracting interest from private equity and infrastructure funds (including Segra’s acquisition of North State and pending purchase of Cincinnati Bell by Macquarie Infrastructure). We expect this trend to continue over medium-term.
According to USTelecom, the industry spent approximately $80 billion on capital expenditures in 2018, up from $75 billion in 2016. Over this period, gigabit services have expanded from covering 9% of American consumers to 80%. Since 1996, the cumulative capital expenditure on fixed broadband is estimated to be more than $1.7 trillion. Throughout the COVID-19 pandemic, broadband networks have proved to be resilient despite increased demands from remote work. According to the NCTA, “over 99% of the customers of major cable operators have not experienced any material impact”. Continued investments in network upgrades have increased speeds and lowered the cost per Mbps for consumers.
Exhibit 7 Average Monthly Prices for the Largest Four Providers of Fixed Services
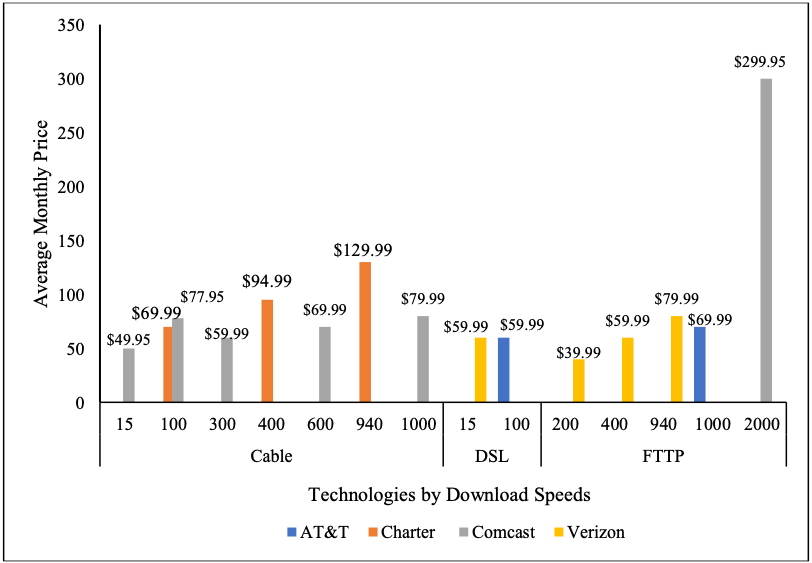
Source: BroadbandNow.com
Since 2015, prices have fallen by over 20% while speeds have increased by 16% for the most popular plans offered by the major providers. Similarly, the highest speed plans are almost 30% faster and 40% cheaper than they were in 2015. According to the 2020 Urban Rate Survey, the average monthly plan price for internet only packages were about $60 for DSL, $80 for cable, $87 for fixed wireless and just over $100 for fiber. As shown in Exhibit 7, the commission report highlights the average prices among the top national broadband providers, which are generally competitive across technology type.
Competition between Fixed and Mobile Broadband Service
As of December 2019, approximately 15 million households relied on a mobile data plan as their only means of access. These mobile-only households represented ~14% of all households with paid Internet subscriptions (out of 95.8 million), up from ~13% in 2016. The increase in mobile-only households is consistent with rising average speeds and availability of 4G LTE mobile broadband networks as well as increasing adoption of “unlimited” plans. With that said, many mobile 4G LTE “unlimited” plans stipulate that during times of network congestion, subscriber traffic could be deprioritized and actual speeds would drop if customers consume beyond a certain limit, which is typically set to no greater than 100 GB. By comparison, many major fixed broadband providers either do not have a data cap or set a cap at close to 1 TB, typically charging $10 for additional 50 GB increments. However, the wireless industry’s move to 5G as well as cable companies’ entry into wireless services will likely increase competition between fixed and mobile broadband services over time.
We have described wireless industry’s transition to 5G in our Spectrumsection above. 5G will bring gigabit speeds to wireless devices. As 5G network coverage increases and consumers transition to 5G-capable devices, mobile broadband connections will become much faster and more reliable and would present a more serious competition to traditional fixed broadband services (particularly for providers who are behind in upgrading their plant). Major wireless operators see fixed wireless services as the second use case behind mobility as they deploy 5G networks. For example, Verizon Wireless continues to target passing 30 million homes with a fixed-wireless broadband offering (5G Home) within 5-8 years. With high-powered CPE in place since October, the range of Verizon’s fixed-wireless broadband service has been extended and the company expects to accelerate its 5G Home rollout in 2021. T-Mobile US, given its large low- and mid-band spectrum position, plans to utilize excess capacity in various markets for fixed wireless broadband. The company had previously said that it expects to be marketing fixed wireless broadband services to 10 million homes by 2026.
To the extent that mobile operators are successful with fixed wireless broadband efforts, cable companies may need to ramp up their wireless efforts. While Comcast and Charter currently have a small market share in wireless and seem content using hybrid-MVNO strategies, they may look for more of ownership economics over time, either by purchasing additional spectrum and offloading more traffic to own facilities or by acquiring a wireless operator (with most likely long-term target being T-Mobile US). In general, we expect increasing convergence between wireless and fixed broadband services over time, with more viable competitive broadband options becoming available to consumers.
VIDEO & BROADCAST TELEVISION
Overview of Video Programming Marketplace
In the U.S., consumers are able to access video programming content from various sources, only some of which the FCC is responsible for regulating and/or licensing. Video providers generally fall into three primary categories: multichannel video programming distributors (MVPDs), online video distributors (OVDs), and broadcast television stations. While these categories of participants have remained constant for the past decade, the video marketplace has experienced a number of changes in terms of consumer viewing habits, new players, and competitive dynamics over the last two years.
Source: S&P Global, Multichannel Operator Peer Analysis
Exhibit 8 Largest MVPDs
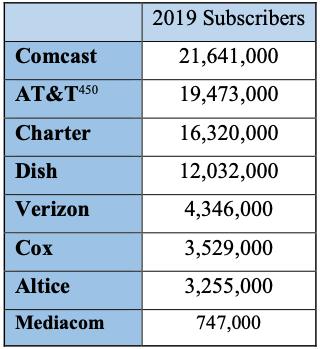
Source: S&P Global, Multichannel Operator Peer Analysis
The television industry is currently in transition as viewers shift from linear to on-demand viewing, which has led to the rise of ‘cord-cutting’ and ‘cord-shaving.’ MVPD subscribers have been declining since 2013, and in total, MVPDs lost about 6.4 million subscribers between 2018 and 2019. However, recent growth in virtual MVPD subscribers has helped to stabilize the US pay-tv landscape.
Multichannel Video Programming Distributors (MVPDs)
Multichannel Video Programming Distributors, MVPDs, are the legacy video content providers in the US. MVPDs bundle a variety of linear channels together and package them for consumers. At the end of 2019, the eight largest MVPDs accounted for approximately 96% of all MVPD subscribers in the US as shown in Exhibit 8. Cable MVPDs historically have had little competition among each other, with limited overlap between their franchise areas. DBS MVPDs DIRECTV and DISH have a national footprint, and telephony companies have overbuilt cable areas so consumers have had more than one option for MVPD service providers. However, they generally faced minimal competition and did little to innovate. In the last decade, the MVPD business model has been under siege by the rise of online video distributors, which we discuss below. MVPD subscriptions have declined since peaking in 2013 as competition from lower priced alternatives like OVDs has grown.
Exhibit 9
Traditional and Virtual MVPD Subscriber Trends by Service Type
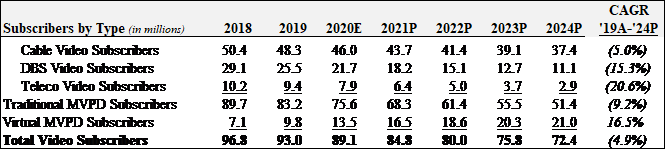
Source: Gabelli Funds estimates and 2020 FCC Communications Marketplace Report.
Longer term, we believe that the MVPD model will be continue to face challenges as higher programming costs will put pressure on profitability. Exhibit 9 highlights projections for the MVPD business in the coming years. Some MVPDs have begun discontinuing sales of MVPD service to new customers, while others are pivoting to a “broadband first” model and disaggregating the traditional “triple play” bundle. Unlike OVDs, most homes only subscribe to on MVPD service. MVPDs are less differentiated than OVDs, as they all tend to off a similar mix of major cable and broadcast networks. They generally do not have any exclusive content. The higher average selling price of MVPD service relative to OVDs has been a significant driver of the shift away from MVPDs with average prices of $65 a month versus free to $20 a month for OVD services.
Online Video Distributors
Consumers have increasing expectations that they are able to get the video content they want, when they want it, and on the device that they want it. This has been driving the growth of the online video distribution (OVD) marketplace. Online video distributors provide their service to customers over the internet on a nationwide basis and do not require specific customer premise equipment. The marketplace breaks down largely into four different models: Advertising-based Video On Demand (AVOD); Subscription Video On Demand (SVOD); Transactional Video On Demand (TVOD); and vMVPD. AVOD services are generally free to the viewer and, as the name implies, supported by ads. Examples include YouTube, NBCUniveral’s Peacock, IMDb TV, and Pluto TV. AVOD usage is growing, and ad dollars are following as noted in the following table.
Exhibit 10 U.S. AVOD Video Advertising Revenue ($ millions)
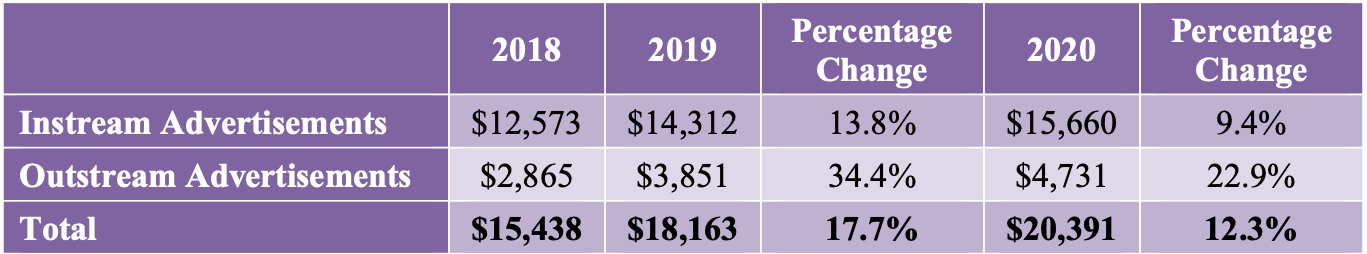
Source: Seth Shafer, Economics of Internet: State of US online video: Ad-supported video, S&P Global at 3 (Nov. 7, 2019); S&P Global, Estimated US instream and outstream video ad revenues, 2014-2023.
SVOD services charge a recurring fee for access to their content. The largest services include Netflix, Disney (Disney+, Hulu, ESPN+), and Amazon Prime. The prices are low enough ($5-20 per month), that many people subscribe to more than one SVOD service. Some providers offer a hybrid model, like Hulu, CBS All Access, and Peacock, which charge a lower subscription fee in exchange for showing some commercials. A survey referenced in the report found that 63% of SVOD subscribers subscribed to more than one. To meet the growing demand for original content and to differentiate their offerings, the major SVOD services have been ramping up their spending. Apple management had said that they expected to spend more than $6 billion on original content for its Apple TV+ service. This December, at the company’s investor day, Disney previewed 100 projects that it expects to release on Disney+ in the coming years. Netflix has also announced more than 70 new feature films on the service in 2021 alone. Consumers will not lack fresh content in the next five years.
Content owners continue to build out their own OVD service instead providing their best content to third parties. HBO Max began offering Friends in 2020 and Peacock began offering The Office at the beginning of 2021. Netflix previously held the streaming rights to both hit shows. Disney had also pulled all of its Disney and Pixar content from Netflix ahead of the launch of Disney+ in 2019. While not all content coming out of the studios will be put on their own platforms, third party content will likely have less exclusivity than it did in the past.
Transactional Video on Demand (TVOD), also known as Premium Video on Demand (PVOD), allows consumers to purchase or rent specific video content without a monthly price. It is most similar to the “On Demand” services offered by traditional MVPDs. Examples of this include Google Play, Apple TV, and Amazon’s Video Store. Some SVOD services have also been experimenting in this area. With the onset of COVID-19 delaying theatrical film releases, Disney decided to have Mulan skip theaters altogether and was offered on its Disney+ streaming service in September for $30 to rent. This release model was generally not well received, as consumers balked at the high price on top of the $7 monthly fee. While the company has not released any data on the success of this trial, it is telling that they have not tried this again.
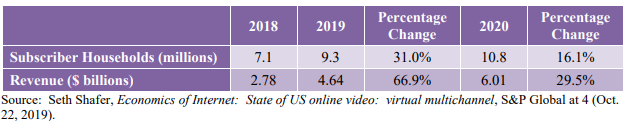
vMVPDs are marketed as a replacement for traditional MVPD service, offering a package of linear local broadcast channels and cable networks over the internet. They do not require specialized customer premise equipment. Pricing generally starts at $20 on the low end without sports content. Most mainstream packages are around $50-70 a month. Like traditional MVPDs, we believe that vMVPDs will face a challenging competitive environment. High subscription prices start to approach traditional MVPD prices once you add in sports, limiting the addressable market. In addition, high programming costs eat in to margins, and it is difficult to differentiate as there is limited exclusive content. On top of that, customers are still shown ads, which hurts the customer experience. Over time, we expect this to be a more niche product targeted to sports fans. Exhibit 11 highlights the decelerating growth among these services.
Exhibit 11 U.S. vMVPD Subscribers and Revenue
In the near term we do not expect significant M&A activity in OVD. Most of the major players are still in the launch phase of their offering, and are seeking to build out their own distribution. Over time, we expect the market to be led by a small number of premium streaming services like Netflix, Disney+ and HBO Max, and they will already have the scale and subscriber base that they need. Acquisition activity among this group is more likely to be focused on acquiring unique IP. Supplementing the premium streamers will be a secondary tier of services. The latter group includes CBS All Access (soon to be rebranded as Paramount+) and Discovery+. We think that deals are possible in this lower tier in the longer term as they seek to expand their scale.
Broadcast Television Stations
Broadcast television stations offer linear video programming channels over the air that households are able to access using a television set connected to an antenna. Households may also receive broadcast TV station programming channels from MVPDs as well as certain OVDs. Broadcast stations generally air programming produced by the station itself (typically local news, sports, etc.) as well as content acquired from affiliate networks and/or syndicators. Broadcast television stations generate revenue from two primary sources: the sale of advertising and payments negotiated with MVPDs and OVDs for the right to retransmit local station signals.
Table 7
Broadcast Television Station Industry Gross Revenue Trends
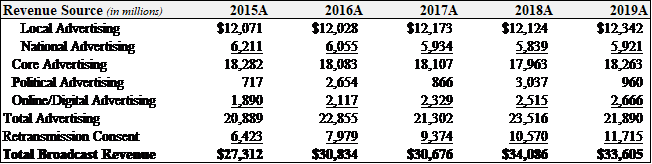
Source: 2020 FCC Communications Marketplace Report data.
Advertising Revenue: Historically, broadcasters generated a substantial majority of revenues from the sale of advertising time on their stations. However, the revenue profiles of TV station groups have become increasingly diversified as retransmission, political advertising, and digital sources of revenue continue to experience growth. In total, advertising, which tends to be volatile, accounted for almost $22 billion or ~65% of total broadcast revenues in 2019, down from ~77% (and nearly $21 billion) in 2015. While advertising has lost share of total broadcast revenues since 2015, the absolute dollars generated from this source has stayed relatively stable over that time period.
Given the regional nature of a broadcaster’s signal, TV advertising remains a fundamentally local business. In 2019, local advertisers accounted for just under 70% of total core advertising (excludes political and online ads). Local TV stations also remain uniquely positioned for political ads given their ability to reach specific demographics and areas. Political ads track the political cycle, with elections occurring in even-numbered years. Across two-year election cycles, political ads as a percentage of total broadcast revenues have remained relatively stable in recent years. Finally, broadcast TV stations also earn advertising revenue from banner or video ads placed on their websites, and this source (often referred to as ‘online’ or ‘digital’ advertising), accounted for nearly $2.7 billion or ~8% of total revenues.
Retransmission Revenue & Reverse Compensation: MVPDs pay broadcasting companies retransmission revenues for the right to retransmit broadcasters’ signals over their own infrastructure. Retransmission fee rates are generally determined by the number of subscribers in the local market multiplied by a contracted rate per subscriber, and are typically backed by multi-year contracts. Many broadcasters have also started to receive retransmission fees from over-the-top virtual MVPDs such as YouTube TV, Sling TV, Hulu Live TV, and AT&T TV Now in addition to the traditional MVPDs. Accordingly, while the cord cutting and shaving has hurt many cable networks, broadcast networks have been less affected. Retransmission has grown from $6.5 billion or 23.5% of total broadcast revenues in 2015 to $11.7 billion or 35% of the total in 2019. Retransmission fees continue to experience growth, and, we estimate that on average, this source accounts for roughly 50% of a pure-play broadcaster’s total revenue over a two-year political cycle today.
Most broadcast TV stations are affiliated with cable networks. The ‘Big Four’ networks are NBC, CBS, FOX, and ABC. Broadcast stations receive a significant portion of their programming from these networks, and therefore, a station’s network affiliation has a substantial impact on its revenue and cost profile. In exchange for network programming, broadcasters allow networks to retain most of the advertising time during network programs as well as the revenue earned from the sale of that advertising time. In exchange, the networks pay a fee known as ‘reverse compensation’ to the broadcasters. The broadcasters retain the revenue from the remaining advertising time during network programming as well as the advertising time it sells during non-network programming. Network affiliation fees have been increasing in recent years, and this trend is expected to continue.
Exhibit 12
Retransmission, Reverse Compensation, & Affiliate Fee Structure
Source: Gabelli Funds (with data from 2020 FCC Communications Marketplace Report).
Station Licensing & Ownership Rules: The number of TV channels available for over-the-air broadcasting in the United States is limited, and each station must be granted a license by the FCC. To ensure a plurality of voices in U.S. media, the FCC imposes ownership restrictions on broadcasting companies. Current regulations disallow a single entity from reaching more than 39% of U.S. television households. However, a station on an ultra-high frequency (UHF) channel is assumed to reach only 50% of the households that very-high frequency (VHF) channel in a similar designated market would reach. Therefore, this ‘discount’ allows broadcasting companies with stations on UHF channels to further expand their reach over those that operate mainly on VHF channels.
Industry Consolidation & Outlook: With the large increase in TV station revenues from political ads, station owners generally wait until an election cycle is completed before selling assets. In our view, the broadcast television industry is in the final stages of consolidation; however, now that the 2020 election cycle has ended, we anticipate TV station M&A activity will begin to pick up.
Exhibit 13
Major TV Station Groups – U.S. TV Household Reached
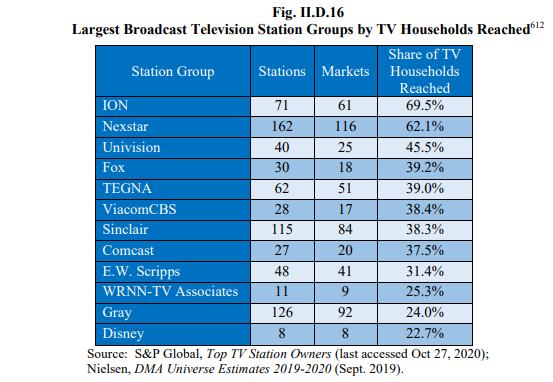
Source: 2020 FCC Communications Marketplace Report.
Competition in Video
While many MVPDs hold content assets of their own, they do not have broad enough distribution to keep this content exclusive on their platform. The main differentiator for MVPDs (and vMVPDs) is the breadth of their sports content. While you can access some sports content through OVDs and broadcasters, only MVPDs have been able to bundle the national cable networks and regional sports networks where a lot of sports content can be found. We don’t expect this to persist over the long term however. ESPN has been building out their sports OVD product (ESPN+) and we expect more to come from them in 2021. In addition, other OVDs are increasingly getting involved in sports rights. Amazon streamed 11 NFL Thursday night games on Prime Video and Twitch during the 2020 season. ESPN’s contract with the NFL ends at the end of the 2021 season, and the rights for the three broadcast networks all expire in 2022. As contracts end across the sports landscape, we expect more deep-pocketed OVDs to participate in sports TV rights in the coming years.
Consumers value flexibility in when they can consume the video content that they want to watch. This has driven the shift away from broadcast and MVPDs and toward OVD. MVPDs have tried to adapt by offering “TV Everywhere”, which allows MVPD subscribers to stream linear channels over the internet. They have also built out DVR capabilities to allow subscribers to shift the time that they can watch linear content. While these features make MVPDs more attractive for subscribers, it simply has not been enough to slow the transition to OVD.
Exhibit 14 Video Subscribers, 2015 - 2019
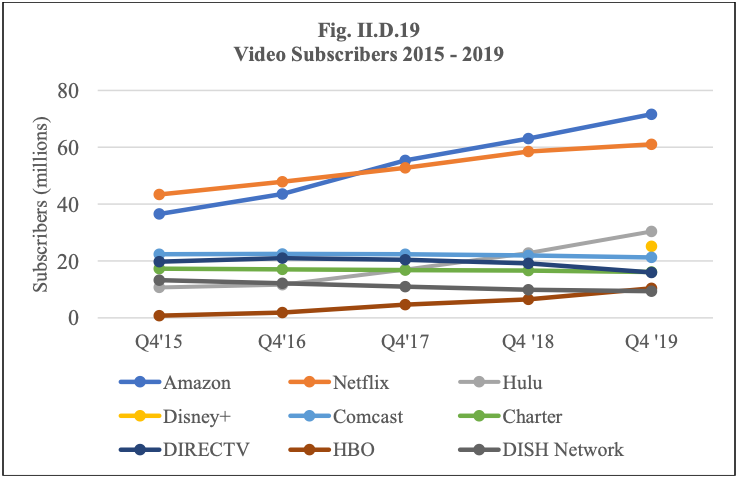
Source: S&P Global, Q4'19 top US video provider rankings (Apr. 23, 2020).
The other major factor has been price. As previously discussed, OVD prices are considerably lower than MVPDs, and often without advertisements. The prices are also more transparent; OVD’s advertised price is what the consumer pays whereas MVPDs typically offer promotional pricing and charge additional fees and equipment rental costs. MVPDs also lock customers in to long-term contracts while OVDs are sold on a month to month basis. The shift from MVPDs to OVD has been accelerated by the COVID-19 crisis, and we expect this trend to persist.