Follow Us x
Utilities
By Timothy Winter, CFA, and José Garza
January 05, 2021
Utilities Under-Perform in 2020
In 2020, the S&P 500 Utilities Index (SPU) returned 0.5% (including dividends) compared to a strong 18.4% return from the S&P 500. During the unusual year, utilities were one of four sectors to lag the eleven-sector S&P 500 despite a 50% drop in the ten-year treasury yield to 0.9%, from 1.9%, and no material change in earnings growth. Notably, the S&P 500 Energy sector was the biggest loser with a 37.3% decline primarily related to the growing ESG movement and its exile of fossil fuel-related stocks.
Table 1 Utilities Over the Past Several Periods
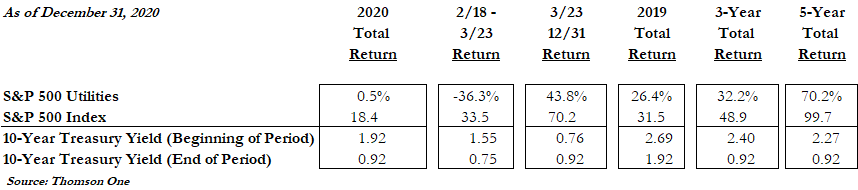
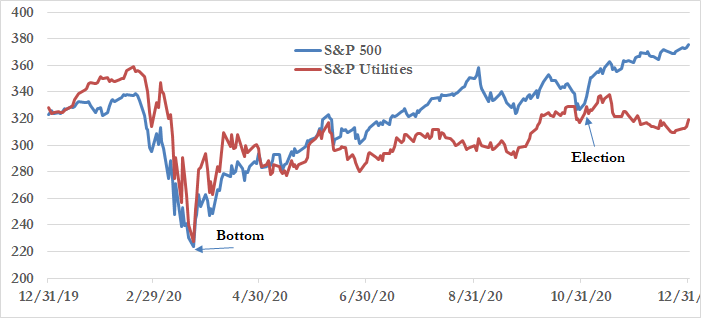
The utility sector began the year with a strong 9.7% rise to an all-time high on February 19, 2020, but then declined significantly (-36.3%) in the volatile COVID-19-infused four-week period ending March 23, 2020. The sector has not yet fully recovered. The SPU climbed 43.8% from its March 23rd-bottom but remains 11% below its high. The S&P 500 on the other hand rebounded a strong 70.2% from its bottom to end the year with a positive 18.4% total return.
Exhibit 1 S&P 500 Utilities and S&P 500 Year-to-Date Performance
Source: Public data
We believe that the utility sector represents a compelling buying opportunity for the following reasons:
1) 2020 Underperformance
2) Attractive valuation multiples, including forward P/E multiple of 17x, down from 23x
3) Competitive current return of 3.4% compared 10-year treasury yield of 0.9%.
4) Above-average rate base, earnings and dividend growth potential
5) Defensive profile during weak economy and minimal COVID impacts
6) ESG profiles improving
7) Renewable and net-zero carbon standards create long runway of rate base investment
Over the next few years, we expect an increasingly favorable clean energy investment environment to help drive infrastructure investment and earnings growth. Most utilities have embraced aggressive climate change standards, including 100% renewable and net-zero carbon standards. While targets could prove aggressive, the massive investment needed to achieve targets are supported by politicians, regulators and customers and will likely drive strong earnings growth for the foreseeable future. New technologies and advancement in battery storage, grid modernization, green hydrogen, electric-vehicle charging stations, rooftop solar, and energy efficiency are likely to help mitigate cost increases. We expect a constructive landscape featuring low financing costs, political and regulatory support, and improving economics to allow for numerous clean energy winners, including select utility stocks and renewable developers.
The 2020 Under-Performance: Small-Cap & Gas Utilities More So
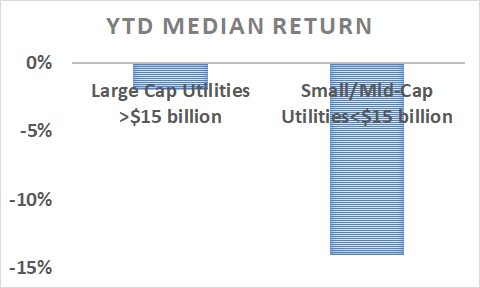
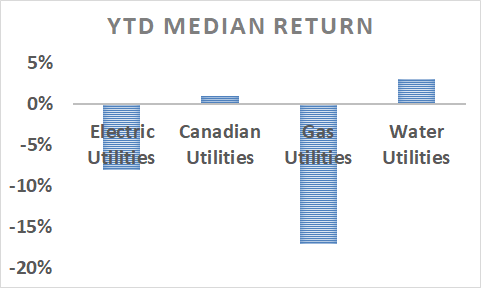
Utility stock under-performance was actually even worse than that of the market-capitalization weighted S&P 500 Utility Index. NextEra Energy (NEE-$77.15-NYSE) represents 16% of the 28-stock index and led the sector with a 30.1% return for the year. The median electric utility declined -8%, including large cap (over $15 billion equity cap) median return of -2% and small/mid-cap (less than $15 billion) electric utility median return of -14%. The median gas utility decline was -17%. See Exhibit 2 below.
Exhibit 2 Small Cap (and Gas Utility Under-Performance)
While the February-March decline in utility stocks was driven by uncertainty over the potential impacts of lost sales due to the economic shut-downs and uncollectible bills, utility stocks remain depressed despite assurances of regulatory recovery of COVID impacts. Further, most utilities maintained initial 2020 EPS guidance (and growth rates) throughout the year. We attribute the underperformance to the following:
1. Utility sector was ahead of itself: Electric, gas and water utility stocks had achieved historically-high valuation multiples (23x forward 2020E earnings) prior to the correction owing to stronger than historical growth rates and a “green energy/ESG” premium.
2. Fear of Missing Out (FOMO): The lure of outsized gains in more exciting sectors as the NASDAQ roared to a 43.6% return, the FAANG stocks to a 58% average return and Tesla (TSLA) to a 744% return, led investors to neglect “dull” and “low growth utilities.” Our FOMO theory is reinforced by the underperformance of the small cap utility stocks as they are also left out of various indices and exchange-traded funds (ETFs).
3. Growing premium to discount gap or margin between “quality/clean” and “dirty” stocks. Gas utilities and electric utilities with midstream, pipeline or gas utility businesses also face challenges of pending net-zero carbon standards. Smaller cap utilities are perceived to have a greater challenge absorbing COVID costs than are larger utilities.
In 2020, at least 20 utility stocks (12 electric and 8 gas) declined more than 15% led by Northwest Natural Holdings (NWN-down 36%), First Energy (FE-down 34%), South Jersey Industries (SJI-down 31%), Unitil (UTL-down 26%) and OGE Energy (OGE-down 25%). See Exhibit 3. FE is the subject of an ongoing bribery scandal involving legislation to subsidize nuclear plants. The biggest decliners in the utility sector tend to have some non-regulated, gas or mid-stream businesses, including NWN, SJI, OGE, Centerpoint Energy (CNP-down 18%), UGI Corp (UGI-down 19%), and PPL Corp (PPL-down 17%). While not regulated utility stocks, midstream companies ONEOK (OKE-down 74%), and Kinder Morgan (KMI-down 48%) also significantly under-performed.
Exhibit 3 Few Electric Utilities With a Positive 2020 Total Return
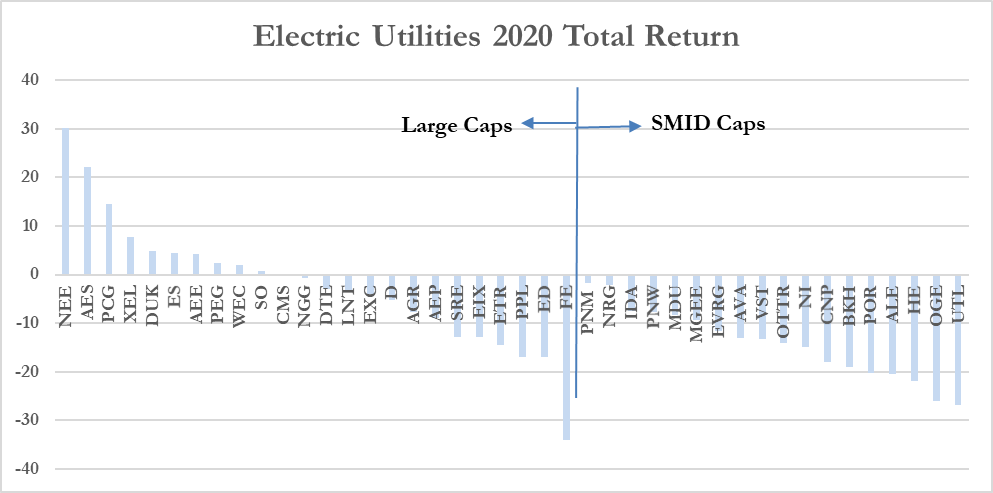
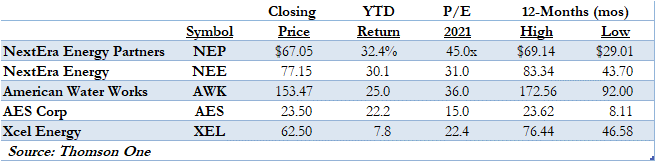
In 2020, the top performing stocks were those with significant renewable development programs, including NextEra Energy (NEE-up 30.1%), NextEra Energy Partners (NEP-up 32.4%), and AES Corp (AES-up 22.2%). A new emerging group of non-regulated power companies, the Renewable Developers, provided a 2020 median return of 67%, including large cap Brookfield Renewable Partners (BEP/BEPC-up 77.5%), a global player with significant hydro capacity, Orsted (DNNGY-up 99%), the world’s leading offshore wind developer, and Ormat (ORA-up 21%), the world’s leading geothermal player. Top-performing US utilities include NEE, NEP, AES, American Water Works (AWK-up 26.9%) and Xcel Energy (XEL-up 7.8%). Each of these utilities is high quality, minimal COVID-19 impact, favorable ESG with strong growth though renewable development.
Table 2 Top Performing Utility Stocks in 2020
Valuation
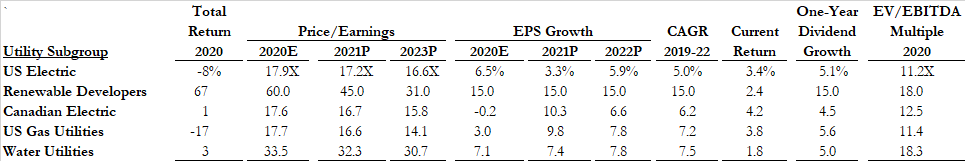
As can be seen in Table 3 and Appendix, median electric and gas utilities declined -8% and -17%, respectively, and water rose marginally +3% in 2020. However, the non-regulated Renewable Developers returned a very strong 67% (See Table 4 on page 9). Given weak utility stock performance, utility valuations have declined from 23x forward earnings to 17.7x and 17.2x 2021E and 2022P estimates. Over the past twenty-years, utility multiples have ranged between 10x and 23x forward earnings with a median of 17.1x. Given the low interest rate environment and strong earnings potential, we believe utility stocks warrant multiples near the higher end of historical levels.
Table 3 Utility Subgroup Statistics
Source: Company documents & Gabelli Funds
Water utilities trade at the highest multiples due to their scarcity, small size, takeover premium, ESG value and long-term growth potential through consolidation and privatization. Gas utilities have lost their premium multiples (historically higher than electrics) and now trade at discounted multiples. In certain coastal states (NY, NJ, CA) gas utilities are hampered by policies that penalize natural gas for being a fossil fuel and hinder the construction of gas infrastructure. Canadian utilities trade at lower multiples due to lower ROEs and equity ratios and an acquisitive nature.
The divergence in multiples between “quality/clean utilities” and “dirty utilities” has led many to announce restructurings or sales of non-regulated businesses, including Dominion Energy (sold its midstream business for $10 billion to Berkshire Energy), DTE Energy (midstream business for sale), Centerpoint Energy (selling its MLP business), PSEG (selling its merchant power business), PPL Corp (selling its UK utility) and Sempra Energy.
Record Capital Investment (Rate Base Growth) Driving EPS and Dividend Growth
According to S&P Global Market Intelligence, electric, gas and water utilities grew EPS 7.4% for the trailing-twelve months ended September 30, 2020. Above-average earnings and dividend growth is driven by record infrastructure investment. Utilities grow earnings by investing in infrastructure otherwise known as growing “rate base.”
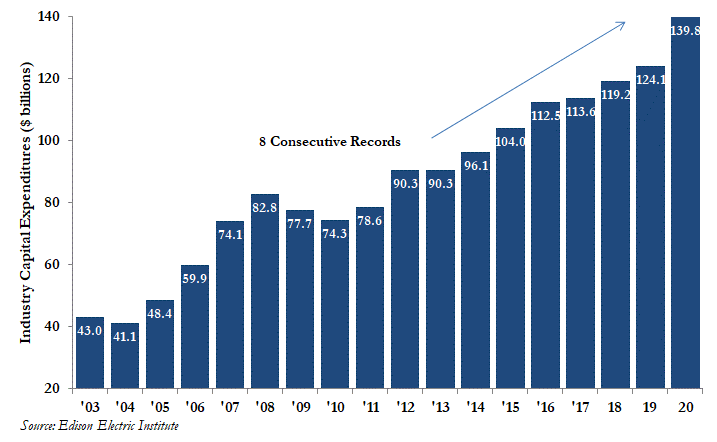
In 2020, EEI forecasts that its member electric utilities invested a record $139.8 billion in utility infrastructure, including distribution ($41.8 billion, or 30%), generation ($37.4 billion, or 27%), transmission ($25.9 billion, or 19%), gas-related ($23.5 billion, or 17%) and other (8%), which compares to a record $124.1 billion in 2019 ($119.2 billion in 2018) and marked the ninth consecutive year of record investment. The successful formula driving the strong earnings outlook remains the same: Investment Opportunities + Constructive Regulation = Earnings Growth. Higher capital investment is related to:
• Clean energy transformation as coal retirements is replaced by natural gas, wind (on/off-shore), and solar;
• Electric transmission (FERC incentives allow favorable returns);
• Distribution investment via grid modernization, reliability, and expansion (automatic rate recovery);
• Natural gas infrastructure, including pipeline expansion and replacement.
Exhibit 4 Record Capital Investment
What does the New Administration Mean for Utility Stocks?
Among the major Biden campaign pledges were the following: 1) more aggressive climate change policy; and 2) higher corporate income taxes. The ability to implement aggressive policy change will be challenged by a relatively split Congress.
(1) While a dramatic transformation in power generation began several years ago and continues to pick up momentum, Biden’s campaign pledged to transition the US to a 100% renewable power by 2035 and a net-zero emission economy by 2050. Such ambitious goals would require an accelerated investment program for electric power companies and new technologies related to battery storage and green hydrogen or carbon sequestration. As a result, the investment opportunity for renewable developers and utilities with renewable development programs would improve. On the other hand, natural gas midstream, pipeline, and gas utilities would face significant challenges. In addition, utilities with a higher dependence on fossil fuels for generation could face challenges given the short-time frame.
(2) Higher corporate taxes would be a modest negative for utility stocks. Regulated utilities would likely be allowed to pass-through higher tax rates via higher customer bills and thus not impact earnings. However, utilities would be forced to request rate increases to cover the higher taxes, which could result in delays, offsets from other base rate increases, negative goodwill or even partial treatment. The Tax Cuts and Jobs Act of 2017 (TCJA) allowed many utilities to offer rate decreases or request authorized returns on a higher rate base without the need for a rate increase. Such a favorable condition would be reversed under a tax increase scenario. Further, higher taxes would negatively impact non-regulated subsidiaries of the following utilities: Otter Tail Corp, Public Service Enterprise Group, Sempra Energy, NextEra Energy, Hawaiian Electric, Avangrid and Southwest Gas.
Extension of Renewable Energy Credits
The year-end 2020 $900 billion pandemic relief bill bundled with a $1.4 trillion omnibus government spending package, includes several provisions designed to boost investment in clean energy.
· Solar Tax Credit: The existing 26% Investment Tax Credit (ITC) available for solar power projects was extended by two years. Solar projects that commence construction before the end of 2022 (formerly 2020) would be eligible for a 26% ITC. The amount of the credit would step down to 22% for projects that start construction before the end of 2023 (2021 under previous law), with further reductions and a phase-out to zero thereafter.
The two-year ITC extension and gradual phase-out would apply to new fuel cells and become available for investments in waste heat energy recovery property (exhaust heat) and energy efficiency improvements to commercial buildings. The previously available tax deduction would become permanent under the new law with the cap of $1.80/square foot indexed to inflation.
· Wind Power Extension: The new law would extend the 1.5 cents/KWh ($15 MWh) Production Tax Credit (PTC) eligibility by one year at the current 60% level for projects that start construction before the end of 2021 (formerly 2020) and in service by 2025 (formerly 2024). Under previous law, the PTC provided for a credit of 1.5 cents per kWh (or 60% of the PTC of 2.5 cents per kWh enacted in 2016, which has since stepped down) to owners of wind-powered generation facilities for energy produced during the first 10 years after the facilities are placed-in-service, so long as construction begins before the end of 2020 and commercial operation starts by 2024. Certain other renewable technologies (like geothermal energy and closed-loop biomass) are also eligible for the credits.
· Offshore Wind Credit Extension: In the new bill, offshore wind farms may elect either the PTC or the ITC. The ITC for offshore wind facilities would remain at 30% for construction that begins before 2025, without any step down during the full eligibility period.
· Carbon Capture: The new bill extends the tax credits for carbon capture, utilization and storage to start construction date of year-end 2025 (previously 2023).
Carbon Reduction Goals and Renewable Portfolio Standards
A proposed US Federal energy plan calls for 100% renewables by 2035 and a net-carbon zero economy by 2050. Many US states have set ambitious renewable energy standards, including 100% renewable energy in New York (by 2040), California (2045), Hawaii (2045), New Mexico (2045) and New Jersey (2045). The European Green Deal calls for Europe to reduce GHG’s 55% by 2030 and enshrines climate neutrality into law by 2050. Utilities across the world have embraced the policy targets due to the increased investment in rate base as well as the potential to displace higher cost assets with lower cost and cleaner assets.
Exhibit 5 State Renewable Standards

Source: S&P Global
In addition, many of the world’s more influential corporations are championing clean energy and have committed to 100% renewable electricity. The RE100 is a global initiative made up of many of the world’s more influential companies (3M, Apple, American Express, Anheuser-Busch, AXA) and share a mission to accelerate change towards net-zero carbon.
Further, numerous investment firms, including the world’s largest asset manager, Blackrock ($7.8 trillion assets under management), and the nation’s third-largest pension fund, the New York State Common Retirement Fund, have instituted increasing climate-related requirements. On December 11, 2020, a group of 30 asset managers (Fidelity International Ltd., Calvert Research & Management, DWS Group GmbH & Co. KGaA, Nordea Asset Management and UBS) representing more than $9 trillion in assets launched the Net Zero Asset Managers initiative to achieve net-zero emissions by 2050 largely by convincing companies in their portfolios and client investors to follow suit. The growth in ESG investing and numerous green energy indices and funds creates significant and growing interest in clean energy stocks and those using clean energy.
Renewable Costs Declined and Now Competitive with Fossil Fuels
Regardless of policy incentives, utilities benefit from adding renewable generation given that significant cost declines have made new wind and solar generation more economical than older fossil-fired and nuclear generation. From 2010-2020, the leveled costs of wind and solar power have declined materially, including wind from $60/MWH to $10-15/MWH (includes tax credits) and solar from $145/MWH to $25-30/MWH. Post 2023 and excluding any tax credits, NextEra Energy (the world’s largest renewable player) expects that new wind ($20-30/MWH) and new solar ($30-40/MWH) will be more competitive than combined cycle gas ($30-40/MWH) and existing coal ($35-50/MWH) and nuclear ($35-50/MWH).
Exhibit 6 Declining Renewable Costs

Source: American Wind Energy Association; Solar Energy Industry Association
Massive Infrastructure Investment
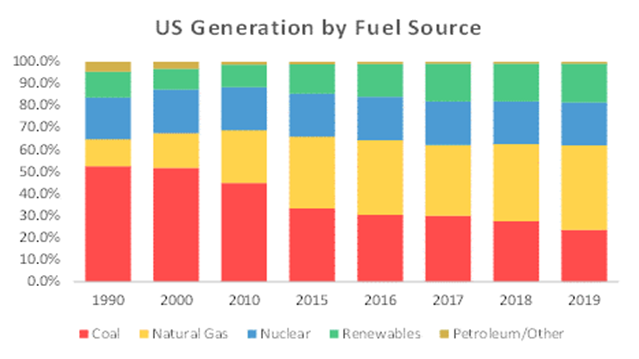
Many North American and European utilities have made significant progress in reducing greenhouse gases (GHG) and other harmful emissions, but the global economy remains in the early stages of a long-term power transformation where coal-fired power plants and less-efficient nuclear and gas plants are being shut-down and replaced with renewable plants and highly efficient natural gas plants. According to the most recent he EIA Short term Energy Outlook, the projected 2020 fuel US mix was 39% gas (up from 23% in 2010), 20% coal (down from 56% in 1986), 21% nuclear, and 20% renewables. All new generation under construction or in development is and will be renewable, renewable/battery-storage and/or natural gas-fired.
The cost of transforming the U.S. electric grid to totally renewable energy in the next 10-20 years would be $4.5 trillion (translates to $300 billion per year over 15 years) given current technology, according to a study by energy-and-industry consultant Wood Mackenzie. Wood Mackenzie estimates that to reach 100% renewable energy would require a “massive investment” to build 1,600 GW of new wind and solar generation and a nearly doubling of high voltage transmission (HVT). The U.S. power grid currently has 1,060 GW of nameplate capacity and 200,000 miles of HVT.
Exhibit 7 US Electric Fuel Mix Has Improved Driven Primarily By Natural Gas
Source: EIA
Renewable Development Utilities Developing to Put in Rate Base
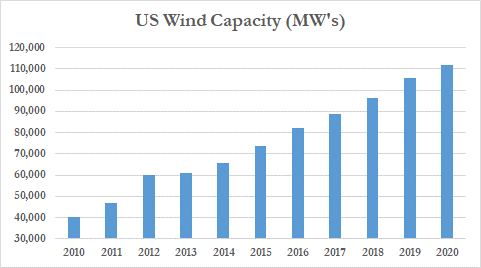
As of third quarter 2020, the US had 111,808 MW’s (73,800 MW’s in 2015) of wind capacity in service with another 43,575 MW’s of new wind projects either under construction or in advanced development (Source: AWEA). Offshore wind projects (discussed on the next page) represent the largest share of that pipeline at over 20% and growing. Year-to-date, the country has added 6,309 MW’s of new wind power, the most ever in the first nine months of a year.
Exhibit 8 Rapid Growth in US Wind Capacity to Accelerate With Offshore Development
Source: American Wind Energy Association
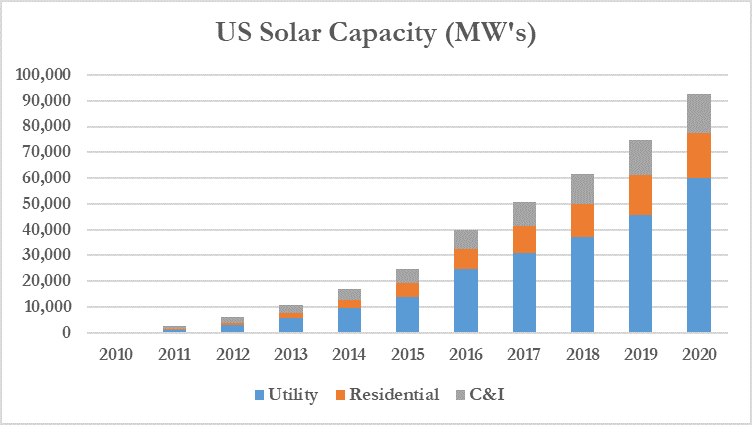
By year-end 2020, the Solar Energy Industry Association (SEIA) expect the US to have 92,000 MW’s of solar capacity in service, including 60,000 MW’s of utility scale, and another 62,000 MW’s of utility scale solar under construction.
Exhibit 9 US Solar Generation Likely to Grow Faster Than Wind
Source: Solar Energy Industry Association
As of June 30, 2020, utilities had 31 GW’s of wind and 39 GW’s of solar under construction to be in service by year-end 2024. To achieve 100% renewable by 2035 requires significant investment and technological breakthroughs in batteries, green hydrogen, carbon sequestration and fuel cells. Over the near-term, we expect utility scale batteries to grow rapidly as the larger batteries piggyback the auto industry.
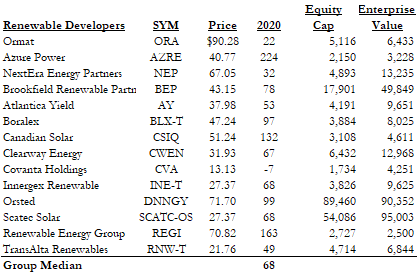
Almost all new renewable generation RFP’s have options for battery storage. The primary beneficiaries of the growing renewable development are the utilities, renewable developers and renewable suppliers. In Table 4, we include the major renewable developers.
Table 4 Renewable Developers
Source: Thomson
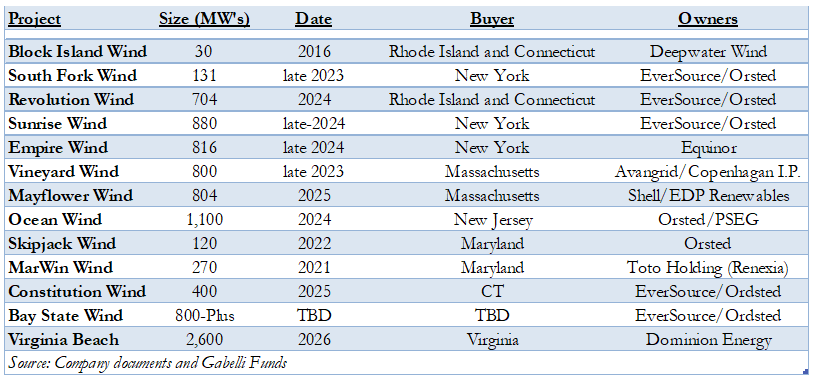
Growing Offshore Wind
On November 19, 2020, the European Commission, released its offshore renewable energy strategy targeting 60 GW’s by 2030, up from 12 GW’s installed today, and 300 GW’s by 2050. The plan also calls for 1 GW of tidal capacity by 2030 and 40 GW’s by 2050. The EU has put offshore wind on track for 25-fold increase to reach 300 GW by 2050. Europe now has a total installed offshore wind capacity of 22,072 MW’s utilizing 5,047 grid-connected wind turbines in 12 countries. Added to projected growth in the U.K., which is expected to have 80 GW’s of capacity by 2050, and Norway, which could contribute 30 GW’s, Europe would reach 410 GW’s of offshore wind within three decades, according to industry group WindEurope. Separately, Japan expects to add 10 GW’s of offshore wind. By 2030, the largest offshore wind markets are expected to be as follows: the United Kingdom (40 GW’s), the U.S. (26 GW’s), Germany (20 GW’s), the Netherlands (12 GW’s), South Korea (12 GW’s), and Japan 10 GW’s.
The AWEA US Offshore Wind Power Economic Impact Assessment found that the US coasts have more than 2,000 GW’s of offshore wind potential, which is nearly double the nation’s current electricity use. The Bureau of Ocean Management (BOEM) has issued 15 active commercial leases to date for the development of offshore wind projects. These lease areas can support over 26 GW’s of offshore wind. Several East Coast states are driving demand for offshore wind by establishing targets to procure a total of 25,400 MW’s of offshore wind a cost of $75-100 billion by 2035. To date, they have selected over 6,000 MW ‘s of projects to help meet these goals.
Table 5 US Offshore Wind Boom
Battery Storage is the Key to Aggressive Renewable Goals
The declining cost of wind and solar and more recently batteries make it conceivable to achieve aggressive renewable targets. Utility scale battery storage represents an option or key element of many new state RFP’s for new capacity or utility integrated resource plan. The price of lithium-ion batteries has fallen by about 80% over the past five years, enabling the integration of storage into solar power systems. The US is on pace to add almost 10,000 MW’s of utility scale battery storage by 2023, according to Platts Analytics’ latest outlook. Battery-backed renewables (mainly solar) smooth output and enable use of the variable resources in hours of peak electricity demand that are typically served by conventional generation. Adding energy storage to renewable generation relieves intermittency issues during sun (or wind) variability as well as midday oversupply for later use.
Gas Utilities, Pipelines, Storage Losing Some Luster
The abundance and low-cost of natural gas has led to significant increase in its use for power generation, residential use and commercial and industrial applications. While natural gas has become a favored US energy source for its cleaner burning properties, abundance and low price, an increasing number of politicians and environmental entities are challenging its future. New York’s 2019 Climate legislation calls for the state to cut 85% of the 1990 levels of greenhouse gas emissions (GHG) from all sources by 2050 (the remaining 15% must be captured or offset), which would result in the eventual elimination of natural gas. Over the past few years, numerous major natural gas pipelines, including Atlantic Coast Pipeline (ACP), Mountain Valley Pipeline (MVP), Constitution and PennEast, have been halted by landowners and environmental groups harboring negative sentiment toward fracking, fossil fuels and the utility sector.
The natural gas industry has lost some its positive reputation/standing/position. An increasing ESG movement could pressure some large investors to avoid these companies. The sentiment bodes well for the electric utilities as it provides the impetus for rate base growth through electrifying entire communities, but does not bode well for gas utilities, gas pipelines and midstream assets.
Could Green Hydrogen Solve the Natural Gas Conundrum?
As the cost of renewable generation declines, the potential for “green hydrogen” (hydrogen created with renewable energy) has rapidly moved from an energy fantasy to a potential reality. An energy economy which includes green hydrogen could significantly help achieve the ultimate goal of a net-zero carbon economy. Hydrogen can be burned as a zero-carbon fuel in hydrogen-compatible turbines to produce electricity, power fuel cells to drive passenger vehicles, heavy-duty trucks, ships and even airplanes, and to heat and light buildings. It will substitute for fossil fuels in industrial manufacturing processes. Hydrogen technology appears to be a promising pathway to enabling longer-term storage of renewable power and decarbonizing industry and transportation.
ROE’s Constructive (Higher Equity Ratios) Relative to Interest Rates
In 2020, many utilities and regulators postponed rate cases to avoid rate increases in the midst of COVID-related health and economic concerns. Based on data from Regulatory Research Associates (RRA) S&P Global Market Intelligence (SPGMI), the average ROE authorized electric utilities was 9.50% (9.44% median) in 38 cases decided in the first three quarters of 2020, below the 9.65% average (9.60%) for the full-year 2019. The average ROE authorized for gas utilities was 9.45% (9.42% median) in 20 cases decided during the first nine months of 2020 versus 9.71% (9.70% median) in 32 cases decided for the full-year 2019. The averages for the first nine months of 2020 are at the lowest levels ever and driven by the lowest interest rates ever.
Currently, there are about 90 rate cases pending with an even greater backlog. The delayed filings and increasing need to address COVID-19 pandemic-related costs and lost revenue, will likely result in a heavy level of rate case activity in 2021. Absent the pandemic, increased costs associated with environmental compliance, generation and delivery infrastructure upgrades and expansion, renewable generation mandates, storm and disaster recovery, cybersecurity and employee benefits have contributed to an active rate case agenda over the last decade.
In cases decided the first nine months of 2020, the average authorized equity ratio for electric utilities was 49.37%. For full-years 2019, 2018 and 2017, the average equity ratios authorized in electric utility cases were 49.94%, 49.02% and 48.90%, respectively. The average allowed equity ratio for gas utilities nationwide in cases decided in the first nine months of 2020 was 51.74%. For full-years 2019, 2018 and 2017, the average was 51.75%, 50.12% and 49.88%, respectively. Taking a longer-term view, equity ratios have generally increased over the last several years — the average equity ratio approved in electric rate cases decided during 2004 was 46.96%, while the average for gas utilities was 45.81%. Many commissions began approving more equity-rich capital structures in the wake of the 2008 financial crisis.
RRA finds that the annual average authorized ROEs in vertically integrated cases typically are about 30 to 65 basis points higher than in delivery-only cases, arguably reflecting the increased risk associated with ownership and operation of generation assets. The industry average ROE for vertically integrated electric utilities was 9.54% in cases decided during the first nine months of 2020, versus the 9.73% average level posted in full-year 2019. For electric distribution-only utilities, the industry average ROE authorized in the first nine months of 2020 was 9.22%, versus 9.37% in full-year 2019.
Allowed ROEs appear to have flat-lined over the past few years, after declining over the past 30-years as U.S. Treasury yields declined. Importantly, the spread between the allowed-ROE and the 10-year U.S. Treasury yield is currently 760-basis points, and it has ranged between 600-850 basis points over the past few years. During the 1990s, the utility sector averaged a roughly 400-600 basis points spread. When combined with opportunities to invest and earn returns on a growing rate base, we consider the allowed-ROEs to be more than adequate to grow earnings and dividends at or above the consensus growth rates.
Exhibit 10 Low Cost of Capital Makes Allowed ROE’s Attractive
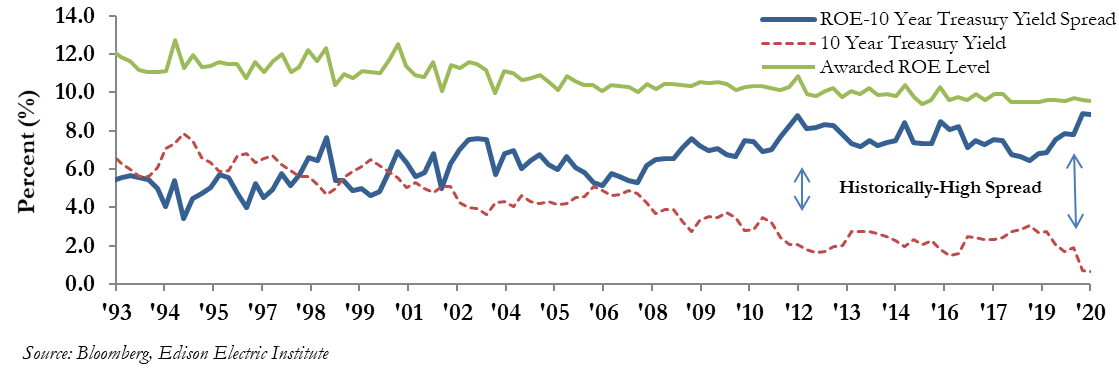
However, given the focus on customers’ ability to pay and the need to maintain universal service as the pandemic drags on, regulators may be more apt to further lower authorized ROEs to mitigate the level of bill increases that result from recovery of pandemic-related costs. These considerations could be further complicated if a new administration seeks to roll back the 2017 corporate tax reform initiatives. Some important ROE awards are highlighted below.
FERC ROE’s Remain Somewhat in Limbo
On November 21, 2019, The Federal Energy Regulatory Commission (FERC) voted to adopt a new ROE methodology and lowered the Midcontinent ISO’s (MISO) existing 12.38% ROE to 9.88% with an upper-end of reasonableness of 12.24%. FERC intents to use the DCF and capital-asset pricing models to establish a zone of reasonableness to evaluate whether an existing base ROE remains just and reasonable. The new methodology will specifically establish quartile ranges based on the risk profile of a utility. For average-risk utilities, the quartile is centered on the midpoint of the zone. The quartile for high-risk and low-risk utilities will be located between the upper and bottom halves of the zone, respectively. Based on the action in the MISO cases, lower ROEs can be expected for the undecided complaints involving New England transmission owners. Other problematic recent regulatory decisions include XEL's partial settlement in CO for 9.30% ROE, and the CNP preliminary outcome in TX (9.25% ROE; 40% equity ratio).
Merger and Acquisition Activity Update
In October of 2020, Avangrid (AGR) announced a deal to acquire PNM Resources (PNM) for $50.30 cash or $5.3 billion enterprise value. However, merger activity slowed in 2019 and 2020 following 23 announced deals in 2016-2018. We attribute less activity to COVID-related factors, fewer utilities, ambitious expectations from potential sellers and strong organic growth expectations. Consolidation activity since 2016 is outlined in Table 6. Since 1995, the electric utility sector has experienced over 145 acquisition announcements, among Edison Electric Institute (EEI) member utilities, and roughly 120 completed deals. The electric and gas utility sector remains fragmented and the forces driving utility consolidation remain in place, including rising capital needs, stagnant demand growth, and economies of scale as well as gaining new footholds or expertise.
Table 6 Recent Utilities Transactions
![]()
Source: Company documents, Gabelli Funds estimates
Larger U.S. utilities, global utilities, value-oriented investors, activist investors and private entities find regulated utilities attractive for the compelling investment opportunity. The utility compact assures that investment in prudent utility infrastructure is recognized and allowed a fair return. As a result, investors benefit from the simple “success formula” (investment + rate recognition = earnings growth). Well-renowned value investor, Berkshire Hathaway, has vowed to be the largest utility in the U.S. Since its 1999 acquisition of MidAmerican Energy, Berkshire Energy has acquired several utilities, including Pacificorp-2005, NV Energy-2013, AltaLink-2014 and attempted others, including Constellation Energy (2008) and ONCOR (2017). Several private equity and infrastructure entities, including KKR, Macquarie, Blackrock and JP Morgan have acquired power generation and electric, gas and water utilities over the years. We believe the Renewable Developers will be highly sought after over the next several years for their development pipelines as well as the footprint into the clean energy business that some seek (I.e. major oil companies).
Utility Valuations Reasonable Relative to Interest Rates Valuation Multiples
Over the past twenty years, electric utility multiples climbed from roughly 10x forward earnings to over 23x, driven by improving fundamentals and lower interest rates (Exhibit 11). Electric utilities trade at 17.9x and 17.2x 2020 and 2021 earnings estimates which are at reasonable levels considering the higher utility earning growth rates, strong fundamentals, near historically low interest rates and ongoing consolidation. As noted, the 10- and 30-year U.S. Treasuries currently yield 0.92% and 1.65%, respectively. Adjusted for interest rates, the P/E multiples appear extremely cheap, considering the strong fundamental outlook, which includes the potential for stronger than historical growth rate (5-7% over the next several years vs. 3-4% in the 1990s) and lower risk profiles.
Exhibit 11 Historically High Absolute P/E Multiples
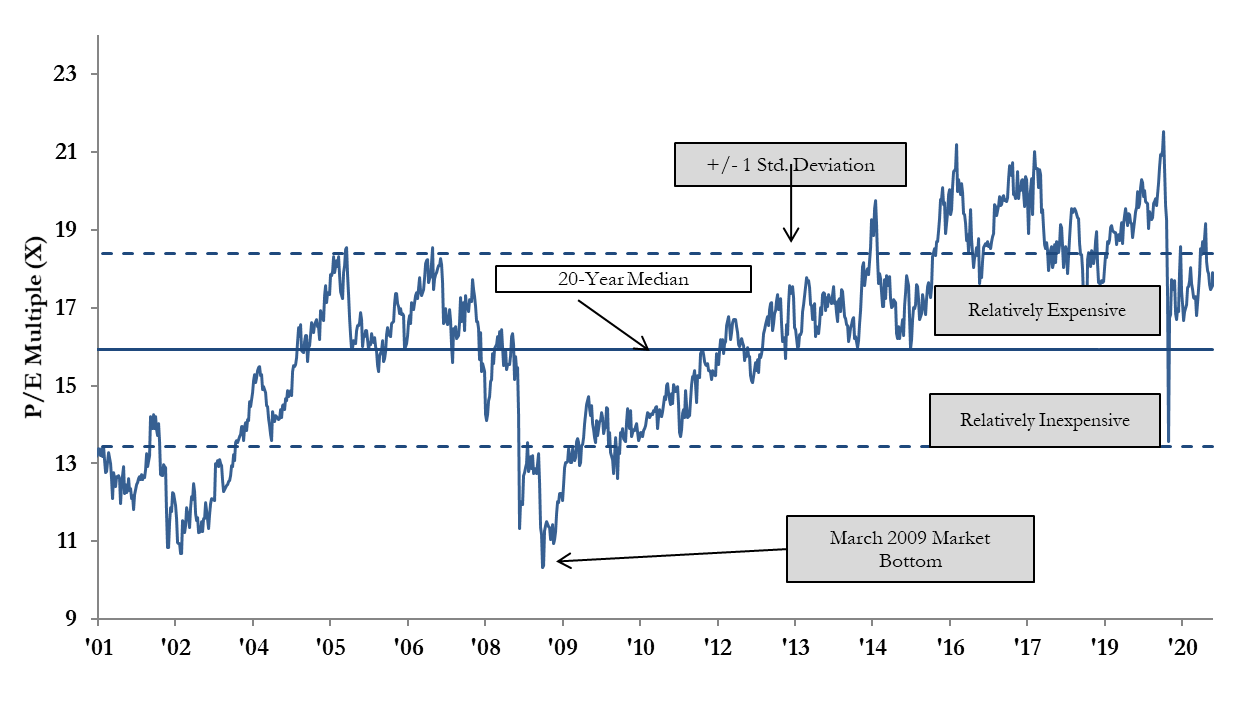
Source: Thomson One, Company documents & Gabelli Funds estimates.
Given that long-term interest rates (specifically the 10-year and 30-year Treasury yields) have been in a secular decline since the late 1980’s, we measure the earnings yield (1/P/E) as a percent of the 10-year Treasury yield to gauge interest rate adjusted valuations. As can be seen in Exhibit 12, the 10-Year T-Bond Yield has declined nearly 100-basis points and resulted in the utility earnings/treasury yield at the high of its historical relationship (off the charts). As such, we consider utility stocks to be inexpensive based on the earnings yield relationship with interest rates over the past twenty years.
Exhibit 12 Utility Earnings Yield as a Percent of 10-Year T-Bond Yield
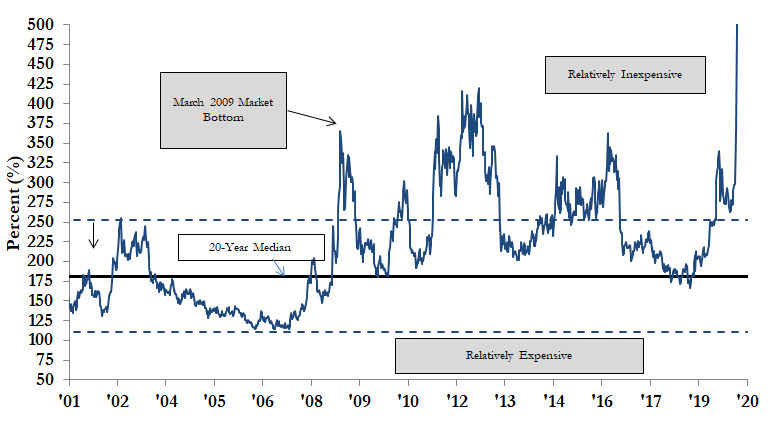
Source: Thomson One, Company documents & Gabelli Funds estimates.
Interest Rates and the Fed
While utility stocks are not bond proxies, and share prices are a function of earnings and dividend growth rates, higher (lower) rates negatively (positively) impact equities, given that future cash flows are impacted by the assumed discount rate. In addition, current utility dividend returns become less compelling when returns on other investments increase, including Treasury yields. The factors below mitigate the negative impact of higher rates.
• Annual dividend hikes: Utilities target annual dividend increases, which serve to mitigate the negative impact of higher rates. In 2020, electric utilities increased the annual dividend by a median of 5.1%.
• ROE is set based on interest rates: A utility’s cost-of-capital, including equity returns (ROEs), is set by state PUCs and increases (decreases) as interest rates rise (fall).
• Annual riders minimize inflation risk: State PUCs and FERC regulatory principles have improved to include more frequent rate adjustments, which mitigate inflation risk.
• Utility stocks pay higher dividends than other sectors: The present value of a higher near term dividend stream is less impacted by changes in interest rates than a lower near term dividend stream.
Exhibit 13 Long-End of Yield Curve Flattened
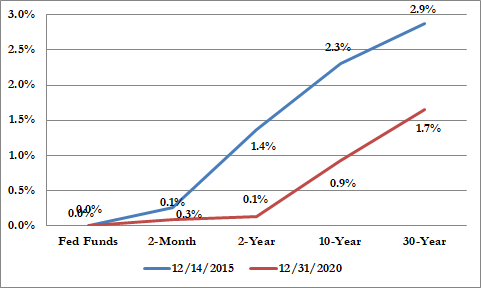
Source: Thomson One and Gabelli Funds
While utility dividend yields and 10-year U.S. Treasury yields are highly correlated and will likely remain so in the future, utility dividends have risen over time (most on annual basis) while the Treasury yield remains fixed. Utility stock prices, unlike Treasury bond prices, are likely to rise should earnings and dividends grow over time. We consider utility stocks to be reasonably-valued based on the earnings yield relationship with interest rates over the past twenty years.
Conclusion
We believe the weakness in the utility sector provides a compelling opportunity. The 3.4% current return is attractive relative to US Treasury Yields, including the 10-Year yield of 0.93% and many utility managements target 5-7% annual earnings and dividend growth. The great transformation of the utility sector from fossil fuel-fired to renewables provides the environment for strong annual earnings and dividend growth. Valuation multiples are below historical levels and utilities offer above-average EPS growth, strong fundamentals, low interest rates and ongoing takeover potential. We believe that the combination of strong utility fundamentals, the Fed’s vigilance, the flattened yield curve, and the potential for escalating geopolitical volatility and/or domestic economic slow-down bode well for the relative performance of utilities.
*See Appendix 1 & 2 in the attached whitepaper pdf